lab02 : Visualizing Climate Change Data
| num | ready? | description | assigned | due |
|---|---|---|---|---|
| lab02 | true | Visualizing Climate Change Data | Thu 01/26 09:00AM | Wed 02/08 11:59PM |
Pair programming for this lab
This lab may be done solo or in pairs. Before you begin working on the lab, please decide whether you will work solo or with a partner. If you decide to work with a partner, there are a few requirements you must follow:
- You and your partner must agree to work together outside of the lab section in case you do not finish the lab during your lab section. You are responsible for exchanging contact information in case you need to reach your partner.
- If you choose to work with a partner for a future lab where pair programming is allowed, then you must choose a partner you have not worked with before.
- You MUST add your partner on Gradescope when submitting your work EACH TIME you submit your file(s). After uploading your file(s) on Gradescope, there is a “Group Members” link at the bottom (or “Add Group Member” under “Groups”) where you can select the partner you are working with. Whoever uploaded the submission must make sure your partner is part of your Group. Click on “Group Members” -> “Add Member” and select your partner from the list.
- You must write your Name(s) and Perm number on each file submitted to Gradescope. Once you and your partner are in agreement, choose an initial driver and navigator, and have the driver log into their account.
Please read this before you start the lab
This lab is designed to run in csil. If you run it on your laptop, it may generate errors due to different version of python. Please make sure you have access to csil. Please contact a TA IMMEDIATELY if you don’t have access to your csil machine.
Academic Honesty
-
All work submitted for this lab should be your own. Do not use code posted on the internet. If you are using any hints from a previous offering of this course that was posted publicly by a CS24 instructor, you must cite your source.
-
You must use the starter code provided for the lab on the release date 2023-01-26. Do not use ANY code from previous offerings of this code. Similarity with old versions of this assignment, including can be used as the basis for academic dishonesty.
Goals of this lab
The goal of this programming assignment is to practice reading and storing data from input files. You are required to parse the data from a csv file, filter the data, smooth the data and plot the data.
We request that you DO NOT ask the staff to debug your code for you. They have been specifically instructed not to debug for you, but rather to guide you through the process of debugging your code yourselves.
Instructions
Step 1: Getting Ready
- Go to github and find a repo for this lab assigned to your GitHub id.
- Log on to your CSIL account.
- Change into your
~/cs24directory - Clone your empty lab02 repo into your
~/cs24directory. - In your empty repo, do
git checkout -b mainto establish that you are on themainbranch as your default branch.
Step 2: Obtain the starter code
The starter code is in this repo:
Previous labs contain instruction for the process of:
- Adding a
starterremote for this repo - Pulling the code from that
starterremote into your own repo.
Please do those steps now, and then do a git push origin main to populate your own repo with the starter code.
If you need help with these steps:
- First consult previous labs for more detailed instructions.
- Then, if you are still having trouble, ask the staff for help during discussion section or office hours.
Once you’ve populated your repo, typing the ls command should show you the following files in your current directory
% ls
2008CompilationData.csv    dataManipulationFuncs.h  matplotlibcpp.h
dataManipulationFuncs.cpp  graphingTool.cpp         Makefile
Step 3: Implement the functions
Assignment Background
This programming assignment investigates oceanic carbon and oxygen isotope ratios over time. These ratios are important since they can help us identify moments of significant temperature change. For example:
- $\delta$18O: oxygen-18 / oxygen-16
- $\delta$13C: carbon-13 / carbon-12
Larger values for $\delta$18O indicate lower temperatures
Smaller values for $\delta$13C indicate higher temperatures.
For more detailed information regarding this assignment, feel free to visit: http://www.discoveringcs.net/7_data_analysis/project7.1.pdf
Step 3a: CSV Parsing
You will find that all the data is given in csv (comma separated values) format, in three main data types.
- First Column: time (Ma - Millions of Years Ago)
- Second Column: $\delta$18O
- Third Column: $\delta$13C
Your Task:
When working with large amounts of data, it is often useful to store it in a data structure such as a vector. In this case, you are required to parse the data into a vector of size 3, whose each element stores each column of the data as another vector.
In dataManipulationFuncs.cpp there is a function with the declaration:
vector<vector<double>> parseData(const string pathToFile, size_t numCol);
Your job is to implement this function by parsing the csv data into a vector<vector<double>>
It takes in two arguments:
const string pathToFile: the relative file location of the csv data.size_t numCol: The number of columns stored by the data.
It outputs:
vector<vector<double>>: This structure which is returned should be a vector of all the data columns, where each column is also represented as a vector.
Notice there are some data entries that are missing for some rows. When parsing the data, if a row is missing data from any column, you should skip including the entire row from your data structure.
Finally, notice that the starter code for that function checks for errors with the file opening process. You should remember to close the file after reading all the data.
Step 3b: Plotting
This step involves getting experience with matplotlib for c++, which is a useful library to produce plots of data.
A good place to get started is the documentation for the matplotlib library: https://github.com/lava/matplotlib-cpp
Go over the README file to familiarize yourself with some of the basics like creating a new figure, making a simple line plot with plt::plot() function, and changing the color of the plot.
Inside graphingTool.cpp you will find a function with the following declaration:
void scatterPlot(
const vector<double>& x,
const vector<double>& y,
const string xlabel,
const string ylabel,
const string title,
const string color);
Your job is to implement this function to correctly produce a scatter plot using any arguments that may be passed in. Here is a more detailed explanation of each parameter:
- const vector
& x: data point values for a independent variable. - const vector
& y: data point values for a dependent variable. - const string xlabel: label for the x-axis.
- const string ylabel: label for the y-axis.
- const string title: title for the given plot.
- const string color: color of each point on the scatter plot. (i.e. “blue” or “red”)
Your implementation should save the resultant image into the CURRENT directory in the format: {title}.png
Learning goals: The main learning goal for this problem is to learn about a new plotting function (plt::scatter()) and how to use a new data structure (std::map) by reading the relevant documentation.
Your scatterPlot() function will use plt::scatter() to create scatter plots and additionally saves the plot as as an image (.png) file. plt::scatter() is similar to plt::plot(). To learn more about the scatter() function here: https://github.com/lava/matplotlib-cpp/blob/master/matplotlibcpp.h#L993
A simple example for using this function is also provided below:
 plt::figure();
 plt::scatter(x, y, 1.0, color);
Note that the third argument to scatter is a C++ map data structure which is similar to Python dictionaries with the difference that map maintains ordering of its elements. Map is used to store key-value pairs and in general can perform search efficiently. To learn more about map, see the documentation here: https://cplusplus.com/reference/map/ Example code is available here: https://cplusplus.com/reference/map/map/at/, https://cplusplus.com/reference/map/map/find/
Step 3c: Filtering
In the real world, sometimes we only care about specific data points with specific qualities. For example, in the case of this programming assignment, perhaps we would only like to analyze $\delta$18O and $\delta$13C in a given time period.
In dataManipulationFuncs.cpp there is a function with the following declaration:
vector<vector<double>> filterData(vector<vector<double>>& rawData, int minAge, int maxAge);
filterData should take in the data stored from the parsed csv and return a new vector<vector<double>> with data points that lie between minAge (inclusive) and maxAge (inclusive). Your implementation should not alter the original data in any way, but should instead return a brand new structure.
Your job in this step is to implement filterData.
Step 3d: Smoothing
Varying results in the data may result in abrupt spikes or dips. Sometimes we want to find general trends in the data by “smoothing” out the curve.
One good way to smooth out the curve is to make each data point an average of those around it given a certain “window” length. “Window” in this case means a sequential grouping of data points within a certain length.
For example, suppose we have a vector of 5 numbers: 4 2 54 1 23. And we will be looking for the smoothed data with window length of 3.
First, we place the window starting at index 0, 4 2 54 will be inside the window. We can calculate the moving average for index 0 is (4 + 2 + 54)/3 = 20
Secondly, we move the window one unit to the right. 2 54 1 will be inside the window. The moving average for index 1 is (2 + 54 + 1)/3 = 19.
By doing the previous step iteratively, we can finally get our smoothed vector: 20 19 26 12 23.
In dataManipulationFuncs.cppp there is a function with the declaration:
vector<vector<double>> smoothData(vector<vector<double>>& rawData, size_t windowSize);
You will also notice a helper function in the same file called getAvgNextValues. This function should be called in smoothData to find the values of the new data points. Note, just like in filterData, you should not alter the data in the original argument, but instead create and populate a new vector structure.
Step 4: What are the plots saying?
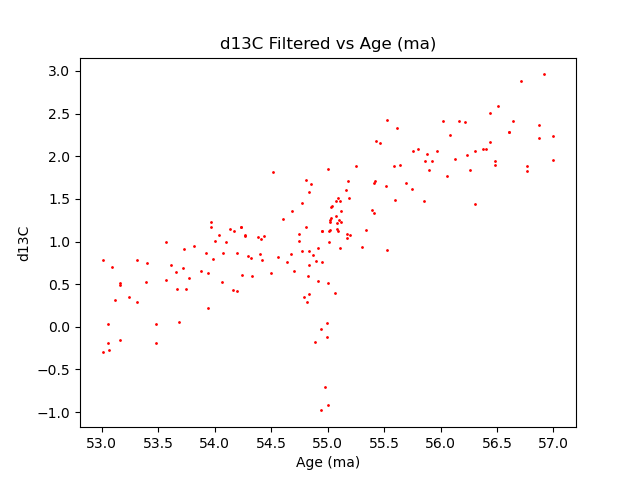
When you are finished, you should be able to type make and then there will be 6 images generated under your current directory. You can verify your functions by comparing the images.
1. d18O vs Age (ma)

2. d13C vs Age (ma)

3. d18O Smoothed vs Age (ma)

4. d13C Smoothed vs Age (ma)

5. d18O Filtered vs Age (ma)

6. d13C Filtered vs Age (ma)
Please note that we will not grade your image. The images are only for you to verify your solutions.
Looking at your smoothed data, you should now clearly see a spike in temperature (i.e., rapid decrease in d18O) around 55 ma. This event is known as the Palaeocene Eocene Thermal Maximum (PETM), during which deep-sea temperatures rose 5 to 6 degree Celsius in fewer than 10,000 years! The fitered plots let you zoom in further to investigate the variations between 53 ma and 57 ma. We have asked you to submit scatter plots for the filtered data. But if you used a line plot, you should be able to see the PETM event more clearly! —
Step 5: Turn in your code on Gradescope
Submit all the .cpp and .h files to Lab02 assignment on Gradescope via your github repo. Then visit Gradescope and check that you have a correct score.
- You must check that you have followed these style guidelines:
- Indentation is neat, consistent and follows good practice (see below)
- Variable name choice: variables should have sensible names. More on indentation: Your code should be indented neatly. Code that is inside braces should be indented, and code that is at the same “level” of nesting inside braces should be indented in a consistent way. Follow the examples from lecture, the sample code, and from the textbook.
- Practice the DRY (Don’t Repeat Yourself) principle. Once you have finished implementing your code, try to find areas that are repetitive or redundant and spend some time to optimize.
Commit and push the latest version of your code on github.
Graders will check your code to make sure it follows the coding style guidelines. Egregious violations to the coding style guidelines may be subject a score reduction for your lab grade. If you are unsure whether your code exhibits good coding style, please ask a member of the course staff during lab.
An important word about academic honesty and the gradescope system
We will test your code against other data files too—not just these. So while you might be able to pass the tests on gradescope now by just doing a hard-coded “cout” of the expected output, that will NOT receive credit.
To be very clear, code like this will pass on gradescope, BUT REPRESENTS A FORM OF ACADEMIC DISHONESTY since it is an attempt to just “game the system”, i.e. to get the tests to pass without really solving the problem.
I would hope this would be obvious, but I have to say it so that there is no ambiguity: hard coding your output is a form of cheating, i.e. a form of “academic dishonesty”. Submitting a program of this kind would be subject not only to a reduced grade, but to possible disciplinary penalties. If there is any doubt about this fact, please ask your TA and/or your instructor for clarification.
Logging out
If you are logged in remotely, you can log out using the exit command:
$ exit
Acknowledgements
This programming assignment is based off an exercise from “Discovering Computer Science: Second Edition”.
- http://www.discoveringcs.net/7_data_analysis/project7.1.pdf